-
What KPIs and Analytics Are Used on Social Work Case Management Dashboards?
Read moreIn social work, complete assistance for people and communities is contingent upon the implementation of efficient case management practices. This...
April 26, 20240 -
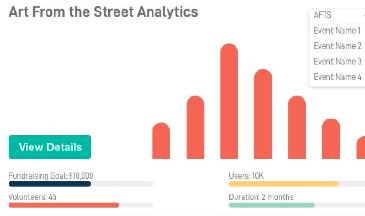
What KPIs and Analytics Are Used on Volunteer Management Software Dashboards?
Read moreThe need for volunteer management software is increasing with the need for efficient and productive volunteer collaboration. This article...
-
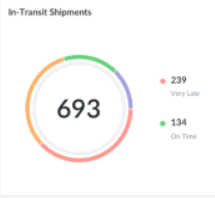
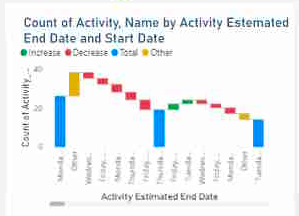
What KPIs and Analytics Are Used on Yard Management Software Dashboards?
Read moreWe will examine the crucial KPIs and charts found in yard management software dashboards in this post, along with...
-
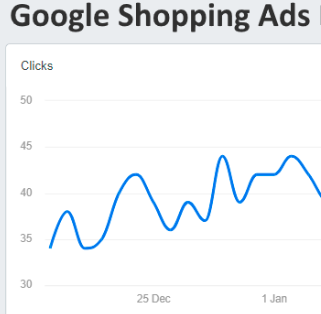
How to Analyze the Performance of Google Shopping Ads
Read moreThis comprehensive guide will delve into the strategies, metrics, and nuances necessary for professionals to effectively evaluate and enhance...
-
Key Ecommerce Dashboard Features
Read moreElevate your e-commerce strategy with the prowess of InetSoft’s Style Intelligence. Interact with and read about InetSoft’s e-commerce dashboard...
